RENEWABLE ENERGY

Solar Farm Drone Inspection Software That Maximizes Production and Minimizes Downtime

Prevents Outages Before They Happen

Utileyes gives solar, wind, and renewable energy operators purpose-built drone inspection software to detect solar panel hotspots, analyze wind turbine blades, monitor inverter thermal performance, and assess vegetation shadowing. Proactive drone inspections support up to a 15% increase in energy output by surfacing performance issues before they cut into production.

15%

increase in energy output reported when proactive drone inspections replace reactive maintenance on renewable energy assets

Based on reported outcomes from solar and wind operators using drone-based proactive maintenance programs

Drone icon

15 minutes

from photo captured in the field to maintenance crew dispatched — with Utileyes

Competitor platforms can take up to 3 weeks from photo to actionable report. Utileyes gets you there in 15 minutes.

Data object icon

3–4 days

to organize field photos with leading competitor software. With Utileyes, that same step takes 5 minutes.

THE CHALLENGE

Why Renewable Energy Operators Are Leaving Production on the Table

Every underperforming solar panel, cracked turbine blade, or overheating inverter is lost revenue. Production losses compound silently across thousands of modules and dozens of turbines, and by the time a monthly performance report flags the issue, the asset has already given back weeks of output. Utileyes was built to close that gap by automating the inspection workflow that solar and wind O&M teams actually run in the field.

3–4 days to organize field photos with leading competitor software. With Utileyes, the same task takes 5 minutes — photos are automatically sorted by GPS asset location the moment they are uploaded.

The Problem

Underperforming solar panels are invisible from the ground

Hotspots, faulty diodes, cracked cells, and PID-affected modules pull down string output without any visible damage. By the time SCADA data flags the dip, weeks of production are already gone.

Wind turbine blade damage compounds quickly

Leading-edge erosion, lightning strikes, and surface cracks worsen with every rotation. Ground-based blade inspections require turbine shutdown, rope-access crews, and significant downtime cost.

Inverter and BOP equipment fail without warning

Overheating inverters, failing combiner boxes, and stressed cabling generate thermal signatures long before alarm thresholds trip. Without regular thermal sweeps, the first symptom is a shutdown.

Vegetation shading slowly steals output

Tree growth, weeds, and ground-cover changes shade modules and increase soiling losses across the season. Ground patrols catch it late, and contractor scheduling delays the fix even longer.
Utileyes drone inspection software logo mark
What Utileyes Does

Renewable Energy Drone Inspection Software Built Around Four Critical Capabilities

Built with direct input from renewable energy operators: designed to solve the problems your O&M team actually deals with day to day.
Utility power grid infrastructure and distribution network

Inverter and Balance-of-Plant Thermal Monitoring

Thermal drone flights surface overheating inverters, failing combiner boxes, and stressed cabling before they trip alarms or cause unplanned shutdowns. Schedule recurring thermal sweeps across the entire BOP footprint without sending crews into hot enclosures.

  • Thermal scans of inverters, transformers, and combiner boxes
  • Severity ranking for predictive maintenance prioritization
  • GPS-tagged anomalies for precise dispatch coordinates
  • Reduces personnel exposure to energized equipment
Accuracy improvement target icon

Solar Panel Hotspot Detection Across Utility-Scale Arrays

Thermal drone inspections surface hotspots, faulty diodes, PID, cracked cells, and string-level failures across an entire solar farm in a single flight session. Inspection teams review thermal and RGB imagery side by side, rank anomalies by severity, and dispatch O&M crews to the exact module location.

  • Thermal and RGB image review in a single inspection workflow
  • Module-level severity ranking for prioritized repairs
  • GPS-tagged anomalies for precise dispatch coordinates
  • Supports radiometric thermal cameras for temperature data
Utility substation being inspected by drone-mounted camera
Drone flight icon

Wind Turbine Blade Analysis Without Lengthy Shutdowns

Capture high-resolution imagery of every blade surface from the air. Inspectors review leading-edge erosion, lightning damage, cracks, and surface defects from the ground, then dispatch rope-access crews only when a confirmed repair is needed.

  • Full-surface blade imagery across pressure and suction sides
  • Reduces turbine shutdown time during inspection
  • Documents defect progression across inspection cycles
  • Photographic record for warranty claims and OEM coordination
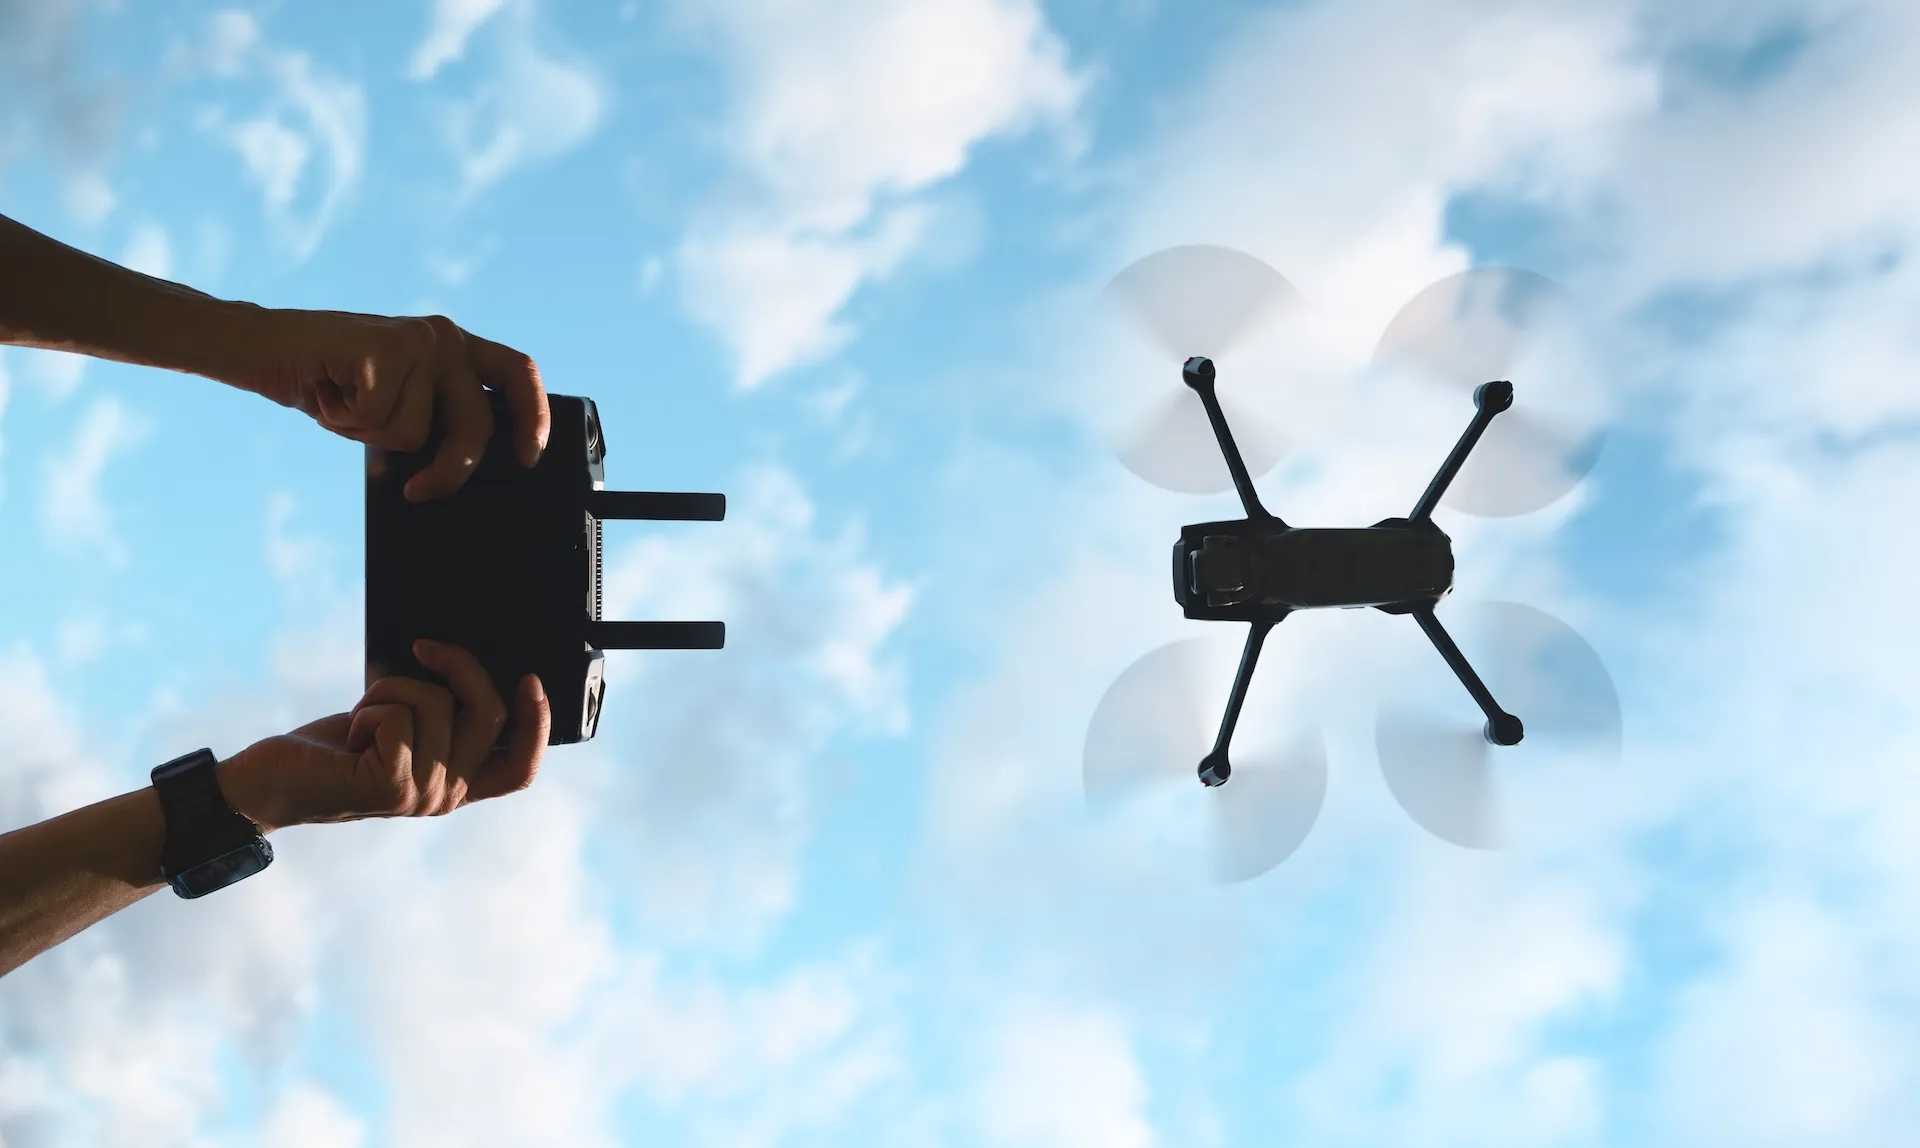
Two inspection drones flying utility powerline route against open sky
Traditional inspection workflow path icon
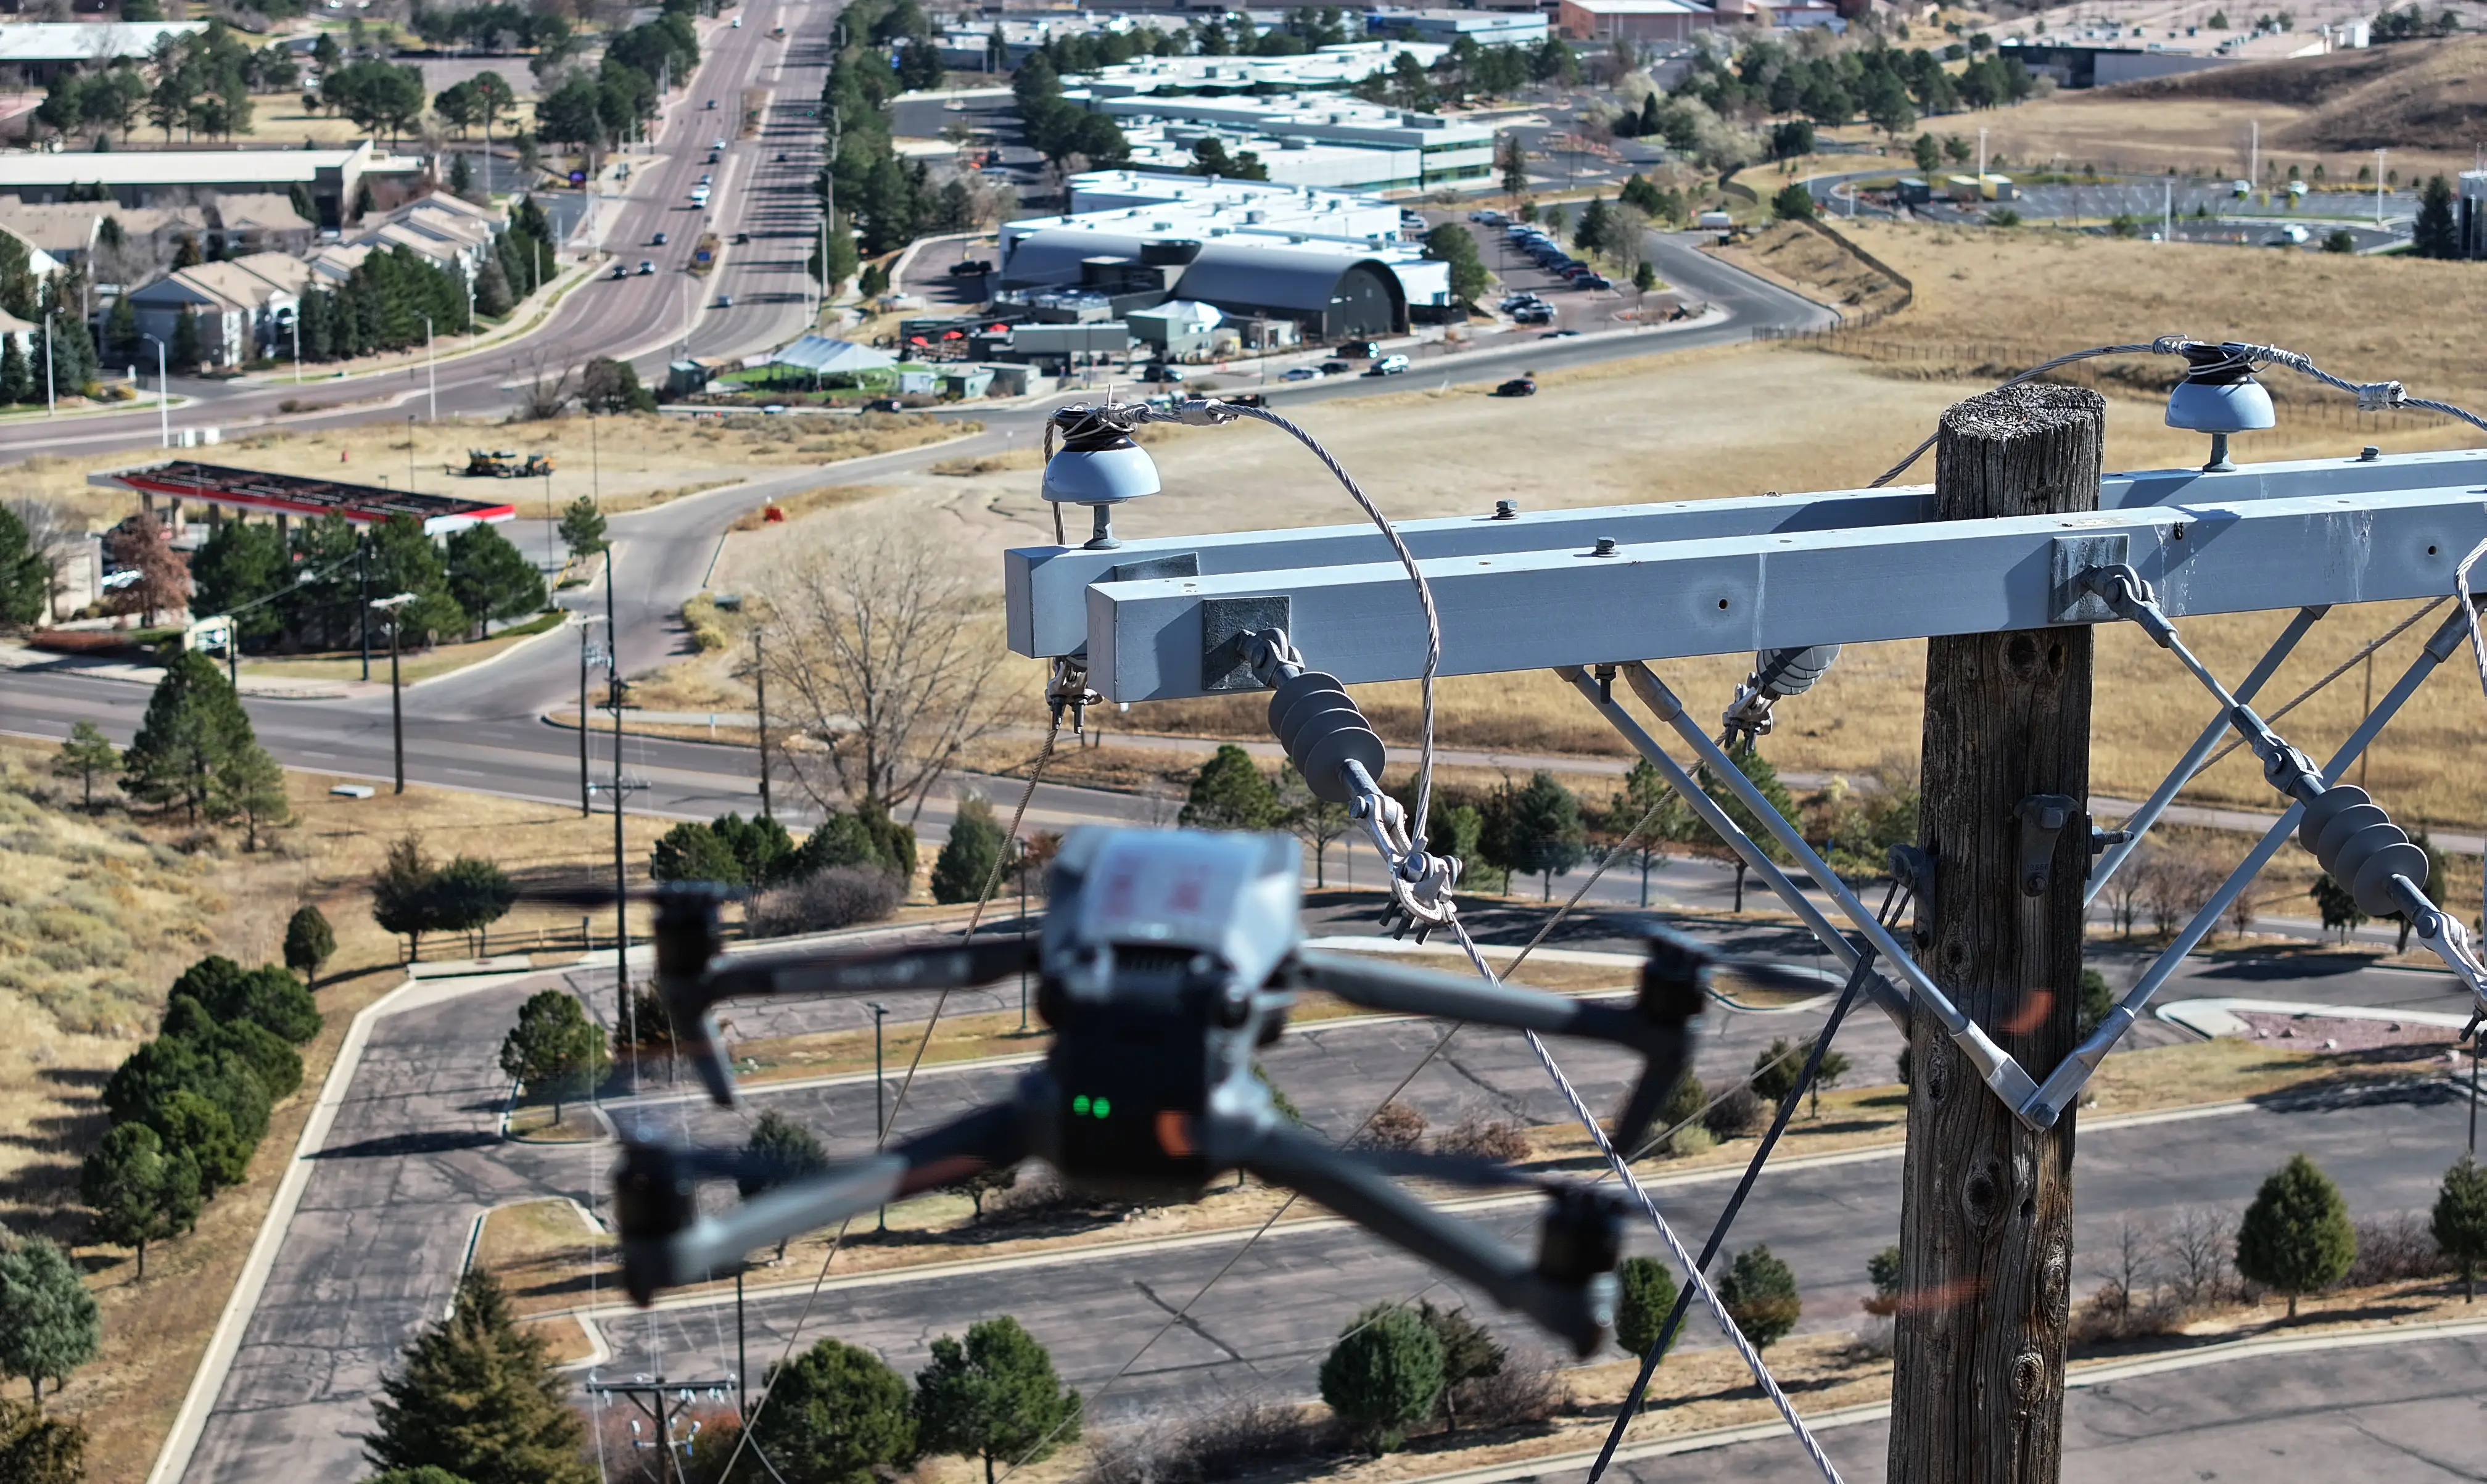
Close-up of inspection drone hovering near utility pole in urban area

Vegetation Shadow and Ground-Cover Assessment

Aerial drone surveys give vegetation management teams a clear view of shading sources, encroaching growth, and soiling patterns across the array footprint. Flag issues by production impact so contractors focus on the highest-yield-loss areas first.

  • Repeatable flight routes for seasonal trend monitoring
  • Shading and growth flagged by proximity to active modules
  • Photo evidence for vegetation contractor work orders
  • Supports soiling and ground-cover trend analysis
Labor reduction engineering icon
The Utileyes Difference

How Utileyes Works: Photo to Dispatch in 15 Minutes

Most inspection platforms still require significant manual work between the flight and the work order. Utileyes automates the steps that slow everything else down: photo organization, asset matching, and report generation. Your team focuses on the inspection itself.

Step 1
Map and Assign

Upload a KML or CSV file, or auto-generate your route from flight data. Assign array zones, turbine rows, and BOP equipment to pilots on the map.

Step 2
Fly and Capture

Pilots execute their flights and capture thermal and RGB imagery. GPS metadata is embedded in every photo at capture.

Step 3
Auto-Organize

Photos upload and sort automatically by asset and GPS location. No manual folder organization required.

Step 4
Inspect and Tag

Inspectors review imagery, tag anomalies, and rank issues by severity using customizable inspection forms.

Step 5
Report and Dispatch

Reports export to CSV or sync with your O&M work order system. Crews dispatched to exact GPS coordinates.

Step 1
Map and Assign

Upload a KML or CSV file, or auto-generate your route from flight data. Assign array zones, turbine rows, and BOP equipment to pilots on the map.

Step 2
Fly and Capture

Pilots execute their flights and capture thermal and RGB imagery. GPS metadata is embedded in every photo at capture.

Step 3
Auto-Organize

Photos upload and sort automatically by asset and GPS location. No manual folder organization required.

Step 4
Inspect and Tag

Inspectors review imagery, tag anomalies, and rank issues by severity using customizable inspection forms.

Step 5
Report and Dispatch

Reports export to CSV or sync with your O&M work order system. Crews dispatched to exact GPS coordinates.

15%

increase on investment through proactive maintenance

Signal disconnected icon

3.1 X

return on investment through reduced truck rolls and avoided outages

Traditional inspection workflow path icon

Less than 30

days from program kickoff to first live inspection flights

Drone icon

15 minutes

photo to dispatch, versus weeks with their previous vendor

PROGRAM OUTCOME

Utility-Scale Solar Operator

How One Solar Operator Lifted Energy Output by 15% After Bringing Drone Inspections In-House

A utility-scale solar operator transitioned away from outsourced thermography vendors and built an in-house drone inspection program. Starting with a single solar farm and two FAA Part 107-certified pilots, they had a functional inspection program running in under 30 days from program launch. By shifting to a consistent in-house inspection cadence — including quarterly thermal sweeps across the array and recurring inverter scans — the operator was able to identify and repair underperforming modules, faulty diodes, and overheating BOP equipment before they cut into seasonal production. After 12 months of proactive drone-driven maintenance, the operator documented a 15% increase in energy output and a 3.1x return on investment through recovered production and reduced truck rolls.

Outcome based on documented results from renewable energy drone inspection programs. Individual outcomes vary based on site size, baseline performance, and inspection frequency.
Utileyes
Capability
Outsourced Vendor Programs
Enterprise Platforms
Photo to dispatch time
15 Minutes
1-3 weeks for final report
Varies-days to weeks
Auto photo organization by GPS
Check icon
(Vendor handles internally)
Varies by platform
Built for in-house utility teams
Check icon
(External service model)
(Enterprise IT focused)
Thermal hotspot detection support
Check icon
Depends on vendor capability
Varies by platform
Operational in under 30 days
Check icon
N/A
(Implementation takes months)
Simple enough for linemen to use directly
Check icon
N/A
(Typically requires dedicated admin)
On-demand deployment post-storm or red flag
Check icon
Subject to vender scheduling
Software only, depends on team
arrow_outward