WILDFIRE RISK MITIGATION

Wildfire Risk Mitigation Software That Shows Utilities Where Every Dollar Reduces the Most Risk

Prevents Outages Before They Happen

Utileyes analyzes wildfire risk at the individual asset level using U.S. Forest Service Wildfire Hazard Potential, inspection status, documented deficiencies, and estimated repair cost, so your team can direct vegetation and maintenance spend where it reduces the most risk.

50%+

inspection cost reduction utilities report after moving from outsourced vendors to in-house drone programs

Based on reported outcomes from utilities that have transitioned to in-house programs

Drone icon

15 minutes

from photo captured in the field to crew dispatched with Utileyes

Other platforms can take up to 3 weeks from photo to actionable report.

Data object icon

3–4 days

to organize field photos with leading competitor software. With Utileyes, that same step takes 5 minutes.

THE CHALLENGE

Why Wildfire Mitigation Budgets Do Not Go Where the Risk Is

Wildfire mitigation plans ask utilities to show not just what they spent, but why. Most teams still prioritize from circuit-level risk maps, inspection spreadsheets, and vegetation reports that do not connect. Utileyes brings wildfire hazard data, inspection status, deficiencies, repair cost, and LiDAR vegetation data together at the asset level, so every work order can be traced back to the risk it reduces.

Wildfire hazard, inspection, and cost data in one view, analyzed at the individual asset level.

The Problem

Risk is assessed by circuit, not by asset

Circuit-wide risk ratings treat every pole the same. A single deficient structure in a high-hazard area can carry more ignition risk than an entire low-hazard feeder.

‍

Inspection gaps hide in high-hazard areas

Without a clear view of which assets have and have not been inspected, uninspected structures in the highest-hazard terrain can go unnoticed for years.

‍

Deficiencies are not tied to cost

Inspection findings sit in one system and repair estimates in another. Without both side by side, it is hard to know which fixes reduce the most risk for the money.

‍

Vegetation and inspection data live apart

LiDAR vegetation data and asset inspection findings are often reviewed separately, so trim crews and line crews work from different priority lists.

Utileyes drone inspection software logo mark
What Utileyes Does

Wildfire Risk Mitigation Software Built Around Four Critical Capabilities

Built with direct input from utility operators, designed to turn wildfire risk data into defensible spending decisions.

Utility power grid infrastructure and distribution network

Risk and Spend Efficiency Analytics

‍

Compare wildfire risk against the estimated cost to repair each deficiency. Prioritize the work that reduces the most risk for the budget available, and document the reasoning behind every spending decision.

‍

  • Estimated repair cost tied to each deficiency
  • Risk and cost reviewed side by side
  • Prioritize repairs based on risk and cost
  • Documentation to support budget and regulatory reviews
Accuracy improvement target icon

Asset-Level Wildfire Risk Scoring

‍

Utileyes analyzes wildfire risk for each individual asset using U.S. Forest Service Wildfire Hazard Potential data alongside inspection history and documented deficiencies. See which structures carry the most risk, not just which circuits.

‍

  • Risk analyzed at the individual asset level
  • U.S. Forest Service Wildfire Hazard Potential included in every assessment
  • Inspection status and deficiencies factored into risk
  • Map-based view of risk across your system
Utility substation being inspected by drone-mounted camera
Drone flight icon

Inspection Coverage Tracking in High-Hazard Areas

‍

Know which assets have been inspected and which have not, layered against wildfire hazard. Close coverage gaps in the highest-hazard terrain first.

‍

  • Inspected and uninspected assets clearly identified
  • Coverage gaps highlighted in high-hazard areas
  • Observations and deficiencies tied to each asset
  • Repeatable inspection cycles for ongoing tracking
Two inspection drones flying utility powerline route against open sky
Traditional inspection workflow path icon
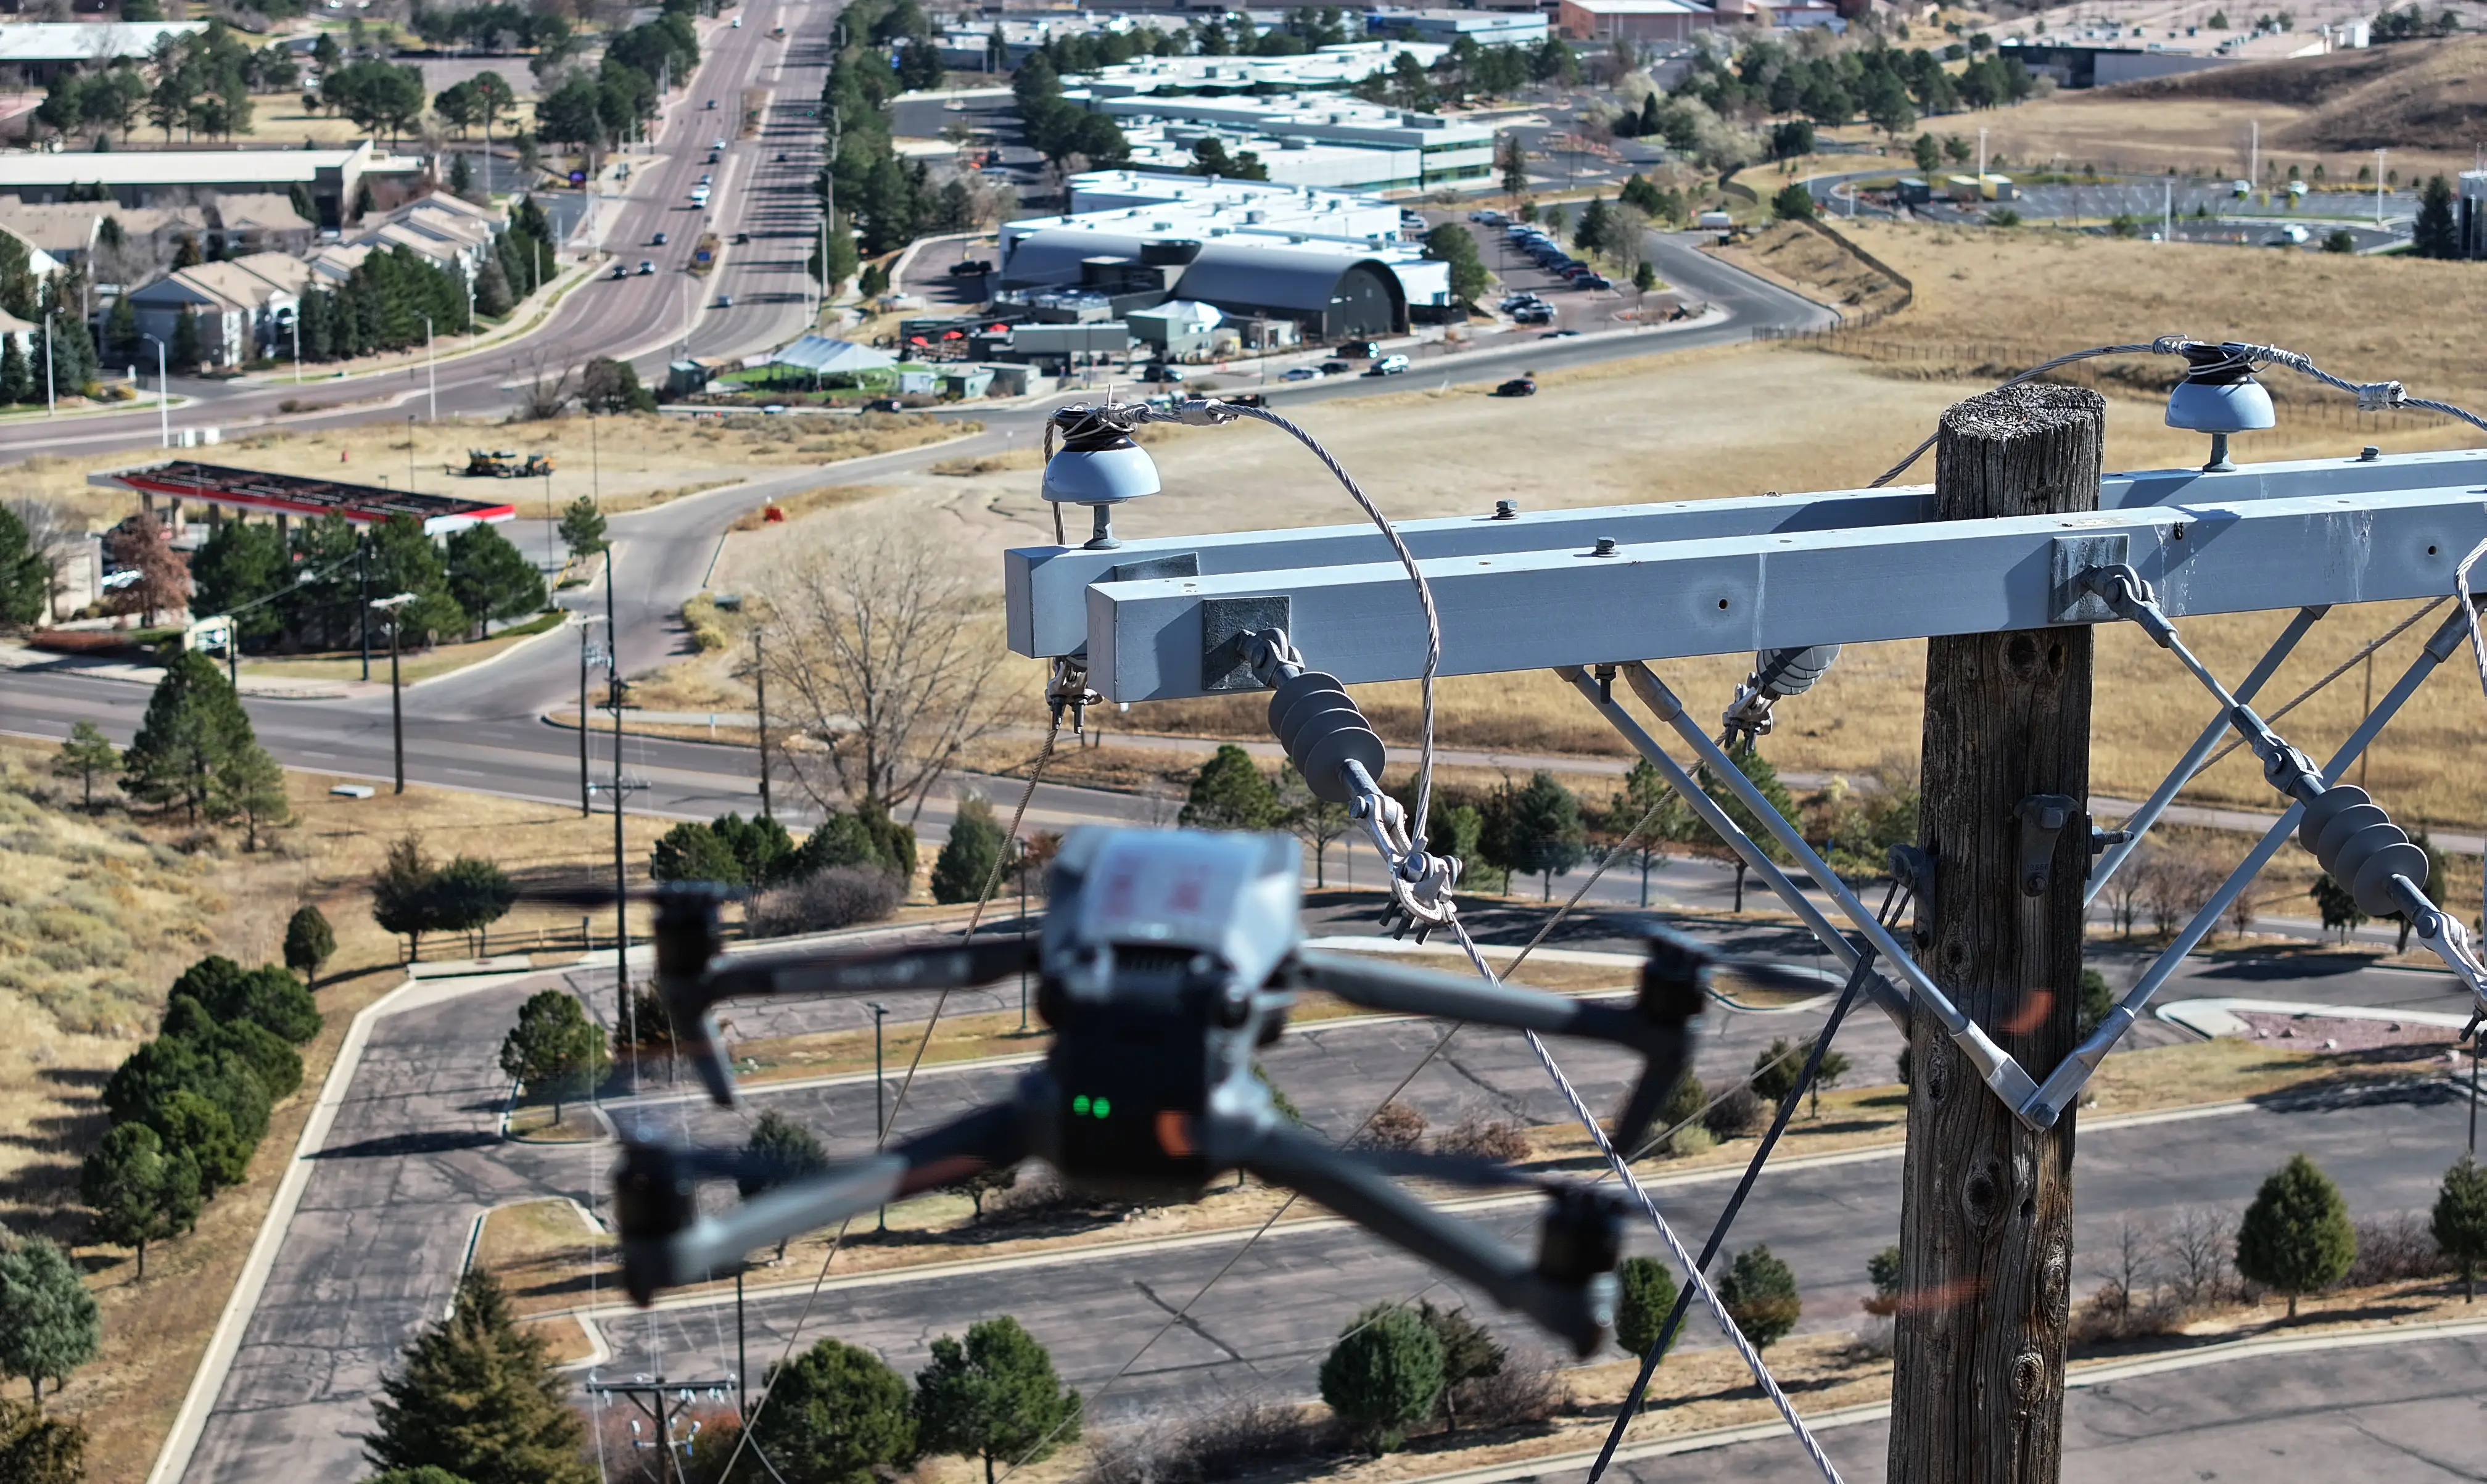
Close-up of inspection drone hovering near utility pole in urban area

LiDAR and Inspection Data for Vegetation Management Decisions

‍

Combine LiDAR vegetation data with asset inspection findings to decide where trimming matters most. Direct vegetation crews to spans where encroachment overlaps with high wildfire hazard and known asset deficiencies.

‍

  • LiDAR vegetation data alongside inspection findings
  • Vegetation priorities informed by wildfire hazard
  • One priority list for trim crews and line crews
  • Supports wildfire mitigation plan documentation
Labor reduction engineering icon
The Utileyes Difference

How Utileyes Works: From Inspection Data to Prioritized Spend

Most utilities already have the data to prioritize wildfire mitigation work. It is just spread across too many systems. Utileyes connects hazard, inspection, cost, and vegetation data so your team can decide where to act and show why.

Step 1
Upload and Map

Upload your asset file and LiDAR data. Utileyes maps every asset against U.S. Forest Service Wildfire Hazard Potential.

Step 2
Fly and Capture

Pilots capture RGB and thermal imagery. GPS metadata is embedded in every photo at capture.

Step 3
Auto-Organize

Photos upload and sort automatically by asset and GPS location. No manual folder organization required.

Step 4
Inspect and Assess

Inspectors tag deficiencies by severity. Findings and estimated repair costs feed into each asset's risk analysis.

Step 5
Prioritize and Dispatch

Rank work by risk and cost, export to your work order system, and dispatch crews to exact GPS coordinates.

Step 1
Upload and Map

Upload your asset file and LiDAR data. Utileyes maps every asset against U.S. Forest Service Wildfire Hazard Potential.

Step 2
Fly and Capture

Pilots capture RGB and thermal imagery. GPS metadata is embedded in every photo at capture.

Step 3
Auto-Organize

Photos upload and sort automatically by asset and GPS location. No manual folder organization required.

Step 4
Inspect and Assess

Inspectors tag deficiencies by severity. Findings and estimated repair costs feed into each asset's risk analysis.

Step 5
Prioritize and Dispatch

Rank work by risk and cost, export to your work order system, and dispatch crews to exact GPS coordinates.

5

critical repairs made before failure in three months

Signal disconnected icon

3.1 X

return on investment through reduced truck rolls and avoided outages

Traditional inspection workflow path icon

Less than 30

days from program kickoff to first live inspection flights

Drone icon

15 minutes

photo to dispatch, versus weeks with their previous vendor

PROGRAM OUTCOME

California Electric Utility

How One Utility Made 5 Critical Repairs Before Failure on Its Highest Fire-Risk Circuits

A California utility added monthly thermal drone inspections across its highest-risk rural circuits. Within three months, the team detected 16 heat anomalies and made 5 critical repairs before failure, including a high-temperature connector replaced two days before it failed under load. Inspection findings were shared with fire mitigation teams and used to prioritize vegetation clearing.

Outcome based on real utility program data. Details represent documented results; individual outcomes vary based on system size, inspection frequency, and baseline conditions.
Utileyes
Capability
Outsourced Vendor Programs
Enterprise Platforms
Photo to dispatch time
15 Minutes
1-3 weeks for final report
Varies-days to weeks
Auto photo organization by GPS
Check icon
(Vendor handles internally)
Varies by platform
Built for in-house utility teams
Check icon
(External service model)
(Enterprise IT focused)
Thermal hotspot detection support
Check icon
Depends on vendor capability
Varies by platform
Operational in under 30 days
Check icon
N/A
(Implementation takes months)
Simple enough for linemen to use directly
Check icon
N/A
(Typically requires dedicated admin)
On-demand deployment post-storm or red flag
Check icon
Subject to vender scheduling
Software only, depends on team
arrow_outward