Quick Summary
- Drone inspection data management is the practice of storing, labeling, checking, and retrieving inspection photos and findings so they stay useful long after the flight.
- The most reliable way to manage inspection data across years is to anchor every photo, finding, and severity tag to an asset ID, not to a flight date or a pilot's folder.
- Consistent forms and severity scales make this year's findings comparable with last year's, which is what turns a photo archive into a condition history.
- Keep each inspection cycle intact and export findings in GIS-friendly formats so the data outlives any single tool or vendor.
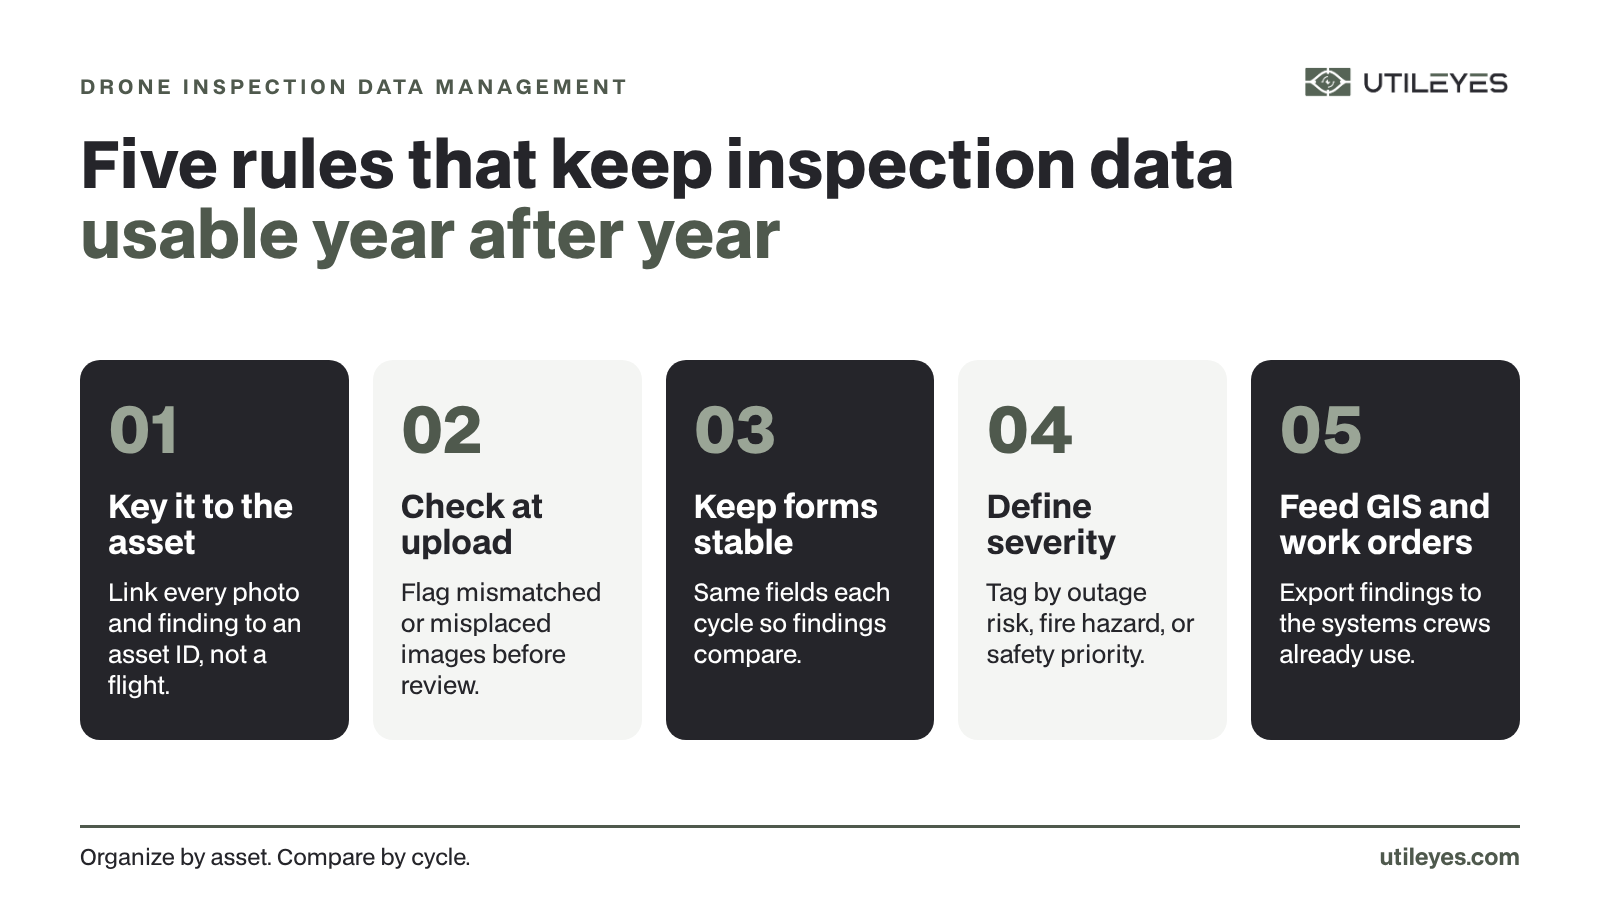
Drone inspection data management means organizing every photo, finding, and severity tag around the asset it describes, then keeping that record usable cycle after cycle. Done well, it lets a utility pull up any pole or span and see what changed since the last flight.
Utileyes is drone inspection software for utilities, built by people who flew utility inspections. This post skips the first-flight questions and looks at year three and beyond, when the data pile gets big and the real test begins.
Most programs handle their first inspection cycle fine. Trouble shows up later, when a supervisor asks whether a cracked crossarm got worse and nobody can find last year's photo.
What is drone inspection data management?
Drone inspection data management is the system a utility uses to capture, check, label, store, and retrieve drone inspection imagery and findings. It covers file structure, asset linking, quality checks, severity tagging, retention, and export. The goal is simple: any authorized person can find the right photo for the right asset in seconds, years later.
It is broader than photo organization. Organizing photos gets one inspection cycle into shape. Data management keeps every cycle connected so the record grows more valuable over time.
A useful working definition has three parts:
- Structure: every image and finding belongs to one asset ID.
- Consistency: the same form fields and severity scale are used every cycle.
- Continuity: old cycles stay intact and searchable next to new ones.
Why does inspection data get harder to manage every year?
Inspection data gets harder to manage because volume compounds while habits stay the same. Each cycle adds thousands of new photos, new pilots, and new naming quirks. Without a shared structure, the archive turns into folders sorted by date or pilot, and comparing one asset across years becomes a manual hunt.
The growth is real. A July 2026 T&D World article on structure-centric inspection management notes that inspection programs that once produced thousands of images now generate millions. The same article points out that images are often sorted by flight or date rather than by asset.
That sorting choice is where most long-term problems start. A flight folder answers "what did we fly on Tuesday?" Operations teams usually need the answer to a different question: "what is the condition of this pole, and is it getting worse?"
Common signs the archive is slipping
- Reviewers ask pilots where a photo is instead of searching for it.
- Two pilots used different names for the same structure.
- Severity labels changed meaning between cycles.
- Last year's findings live in a spreadsheet nobody can match to this year's photos.
How should utilities structure drone inspection data by asset?
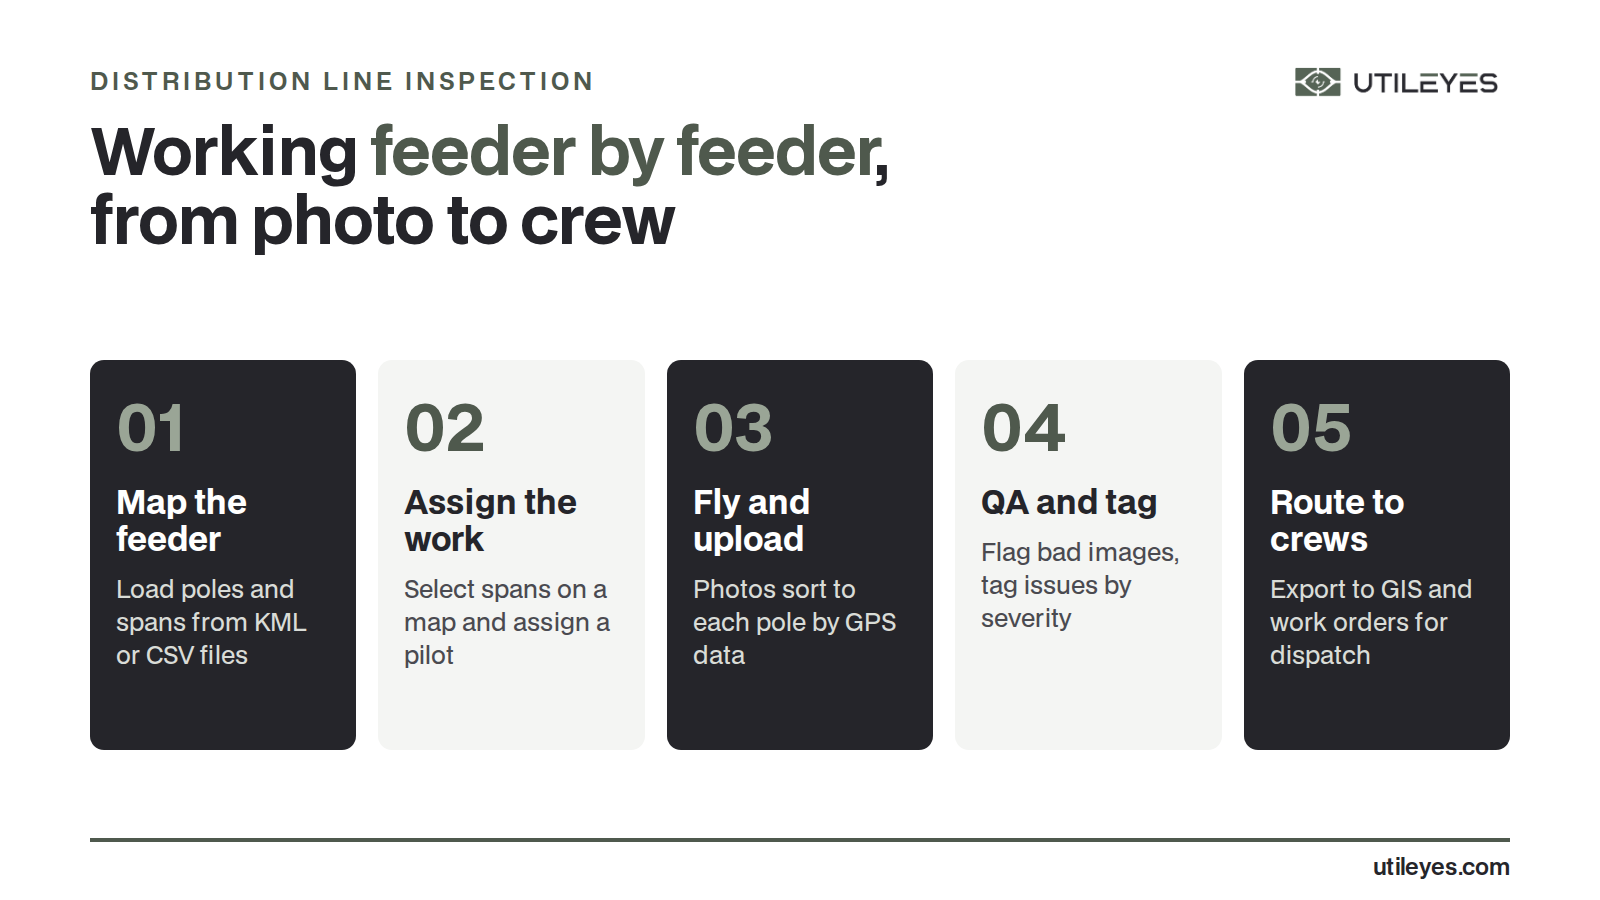
Utilities should make the asset ID the primary key for all inspection data. Start from the asset records the utility already trusts, such as KML or CSV files from GIS. Match each photo to an asset using GPS metadata, then attach findings, form answers, and severity tags to that same asset record.
This is the structure Utileyes is built around. Asset maps can come from KML or CSV files, or from asset points generated in flight. Photos dropped into an upload are auto-organized by GPS location and asset ID, so nobody renames files by hand.
Checks belong at the front door, too. Utileyes runs built-in QA that flags mismatched or misplaced images during upload. Catching a photo tagged to the wrong pole on day one is far cheaper than discovering it during a repair three years later.
Keep forms and severity scales stable
Comparisons across years only work when the questions stay the same. Use customizable inspection forms, but change them on purpose and rarely. Tag severity to the utility's own standards, such as outage risk, fire hazard, or safety priority, and document what each level means.
How do you compare the same asset across inspection cycles?
To compare an asset across cycles, keep each cycle's photos and findings intact under the same asset ID, then review them side by side. When forms and severity scales stayed consistent, a reviewer can see whether a defect is new, unchanged, or getting worse, and set repair priority from that trend.
The table below shows how a one-cycle mindset differs from a multi-year one.
| Data practice | One-cycle approach | Multi-year approach |
|---|---|---|
| File structure | Folders by flight date or pilot | Every photo linked to an asset ID |
| Quality checks | Spot checks after review starts | Mismatched images flagged at upload |
| Inspection forms | Edited each season | Stable fields, changed on purpose |
| Severity tags | Reviewer judgment, loosely defined | Documented scale tied to utility standards |
| Old cycles | Archived or overwritten | Kept intact and searchable by asset |
| Export | Ad hoc spreadsheets | CSV export compatible with ArcGIS/ESRI |
Side-by-side review helps here as well. Utileyes supports side-by-side RGB and thermal review, which keeps visual and heat evidence for the same component on one screen.
Where should drone inspection data live after review?
Reviewed inspection data should live where operations teams already work. Findings belong in GIS and work order systems, linked back to the source photos. Inspection software should feed those systems rather than replace them, so the condition record stays tied to the utility's official asset data.
Utileyes integrates with existing GIS and work order systems and offers CSV export compatible with ArcGIS/ESRI. For a deeper look at that handoff, see how drone inspection software integrates with GIS and work order systems.
Executive dashboards round out the picture. Leaders can track coverage, anomalies, and efficiency without opening a single photo folder.
Plan for retention up front
Retention rules vary by utility, regulator, and asset class. Decide how long each cycle is kept before the archive gets large, and write it down. A clear rule is easier to follow than a cleanup project later.
What does good data management look like in the field?
In practice, good data management shows up as speed. When photos land already sorted by asset and checked for mistakes, reviewers start tagging right away. With Utileyes, the path from photo captured to crew dispatched can take as little as 15 minutes.
That speed came from the field. The founders personally flew 10,000+ utility inspections, and the leadership team has 50+ years of combined utility operations experience. Utileyes was built with utility linemen and drone pilots, which is why it treats the asset, not the flight, as the center of the record.
Owning the data in-house matters for cost as well. Running inspections in-house with Utileyes comes in at about 50% lower inspection cost than outsourcing to vendors. Learn more about the workflow on the How It Works page.
Frequently Asked Questions
What is the difference between photo organization and data management?
Photo organization sorts one batch of images so reviewers can work. Data management keeps every batch connected to assets, forms, and severity tags across many years. The second depends on the first, but it also covers QA, retention, and export.
How should drone inspection photos be named?
Manual naming tends to break down as teams grow. A better approach is to let software read GPS metadata and link each photo to an asset ID automatically. The asset ID then does the work a file name used to do.
Can drone inspection data be exported to ArcGIS?
Yes, if the software supports it. Utileyes offers CSV export compatible with ArcGIS/ESRI, so findings can move into the GIS a utility already uses. That keeps condition data next to official asset records.
How long should utilities keep drone inspection data?
There is no single answer, because requirements differ by utility and regulator. Most teams benefit from keeping enough past cycles to see condition trends on each asset. Set a written retention rule early and apply it consistently.
Do small utilities need a data management plan?
Yes. Co-ops and municipal utilities often have fewer people to chase missing photos, so structure matters even more. Starting with asset-based organization on the first cycle avoids a cleanup later. The Utileyes FAQ covers how teams get started.
Make Every Inspection Cycle Count
Drone inspection data management is what turns a stack of flights into a condition history your crews can act on. Anchor data to assets, check it at upload, keep forms steady, and let it flow into GIS and work orders.
Want to see how Utileyes keeps every cycle organized by asset? Schedule a demo.